
Defender Vulnerability Management – The Exposure Score Just Got 4 Major Interesting Changes
You’ve been there. You patched 40 CVEs across your fleet, went back to the dashboard, and the exposure score barely moved. You had to explain that to a manager and it wasn’t fun.
That’s not just bad UX – it was a real modelling problem with how Microsoft calculated the score. And on May 31, 2026, they officially acknowledged it and launched an updated exposure score model in Exposure score in Defender Vulnerability Management, now in public preview.
This post breaks down exactly what changed, layer by layer.
Table of Contents
What is the Exposure Score
The exposure score in Defender Vulnerability Management is a 0-100 metric that represents how vulnerable your organization is to cybersecurity threats, based on the devices onboarded to Defender for Endpoint. The bands are:
- 0-29: Low
- 30-69: Medium
- 70-100: High
It’s the metric that feeds remediation prioritisation. Security recommendations are ranked by their potential to reduce it, which gives you a way to explain to leadership not just what you’re fixing, but why you’re fixing it in a particular order.
The problem was that the old model had a credibility problem. Remediation didn’t reliably move the score. That disconnect undermined the whole value of using it as a communication tool.
What Changed – The Four Layers
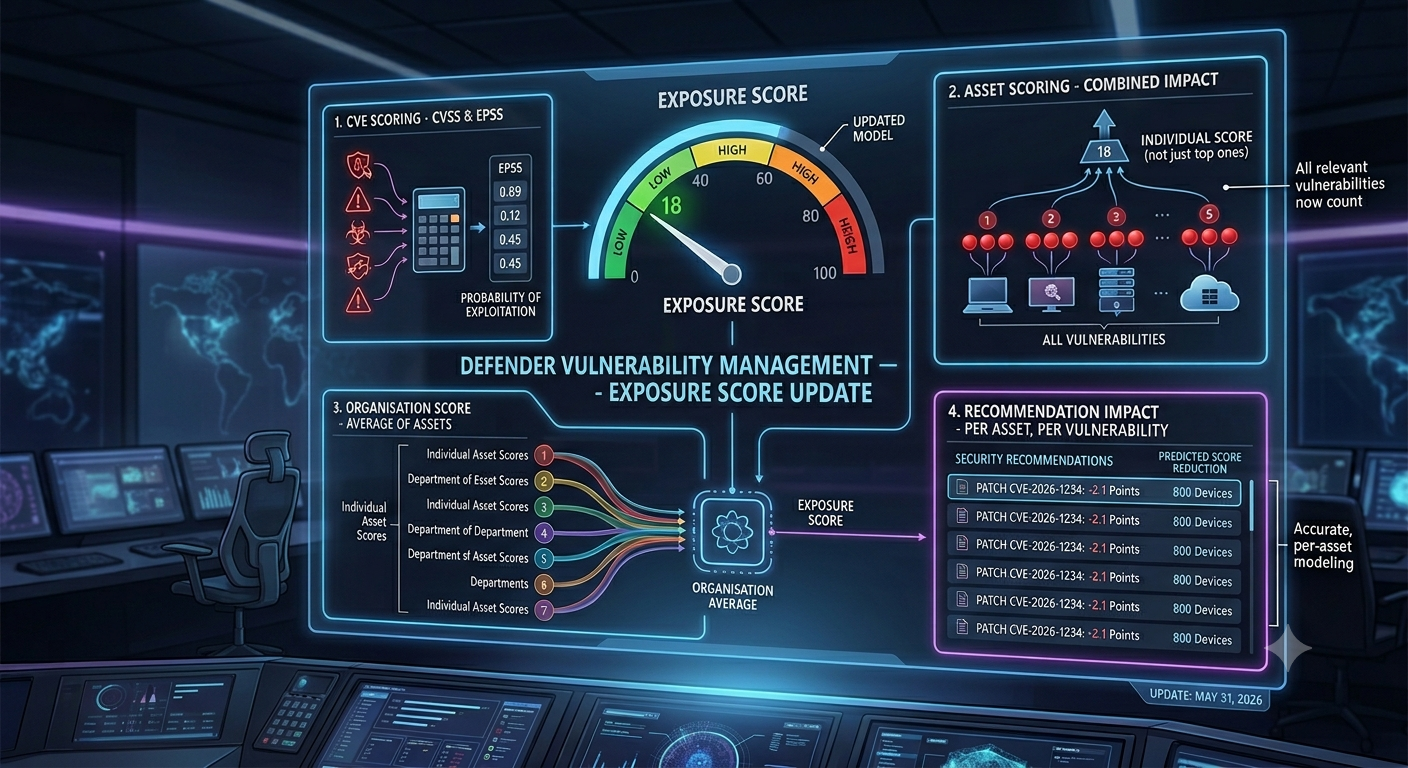
The update touches every layer of how the score is calculated – from individual CVE scoring all the way up to the organisation-wide number.
1. CVE Scoring – EPSS is Now Part of the Equation
The old model was primarily CVSS-driven. CVSS tells you how bad a vulnerability could be exploited, but it says nothing about whether someone is actually exploiting it right now, or is likely to.
The updated model now incorporates EPSS – the Exploit Prediction Scoring System. As documented in the vulnerabilities page, EPSS is a data-driven model that produces a probability score between 0 and 1 for each CVE, representing the likelihood of exploitation in the wild. The higher the EPSS score, the greater the probability that a vulnerability will be exploited.
What this means in practice: a CVE with CVSS 7.5 and 0.1% EPSS probability is now weighted differently than a CVE with CVSS 7.5 and 34% EPSS probability. The latter is being actively attempted at scale in the wild. Your exposure score now reflects that distinction.
Microsoft also normalises CVE-related fields for consistency across vulnerability sources, which reduces scoring noise from inconsistent data ingestion.
Why it matters: Prioritization based purely on CVSS severity is a well-known problem in the industry. EPSS shifts the model towards real-world exploitability rather than theoretical severity – which is a meaningful improvement for anyone trying to justify remediation decisions using actual threat intelligence.
2. Asset Scoring – All Vulnerabilities Count Now
This is one of the more consequential changes.
In the old model, a device’s contribution to the score was driven primarily by its top vulnerabilities – the ones with the highest individual severity. Everything else was largely ignored in the per-device calculation.
The updated model calculates each device’s score as the combined impact of all relevant vulnerabilities on that device. A device with 60 medium-severity unpatched CVEs now correctly looks worse than one with a single high CVE and nothing else, even if the raw CVSS numbers might have suggested the opposite.
On top of this, asset context is now a factor: internet-facing status and asset criticality are included in the device scoring calculation. A domain controller exposed to the internet with 20 medium CVEs should score very differently from an isolated internal server with the same 20 CVEs. The updated model now reflects that.
Why it matters: The old approach had a flattening effect. High-risk devices with many medium-severity CVEs could look deceptively safe because no single CVE was severe enough to dominate the per-device score. That gap is now closed.
3. Organisation Score – Average of Assets
The organisation-level score is now calculated as the average of individual asset scores, giving a more representative view of your actual fleet-wide posture.
The previous aggregation could be skewed at scale – a small number of extremely vulnerable devices could distort the score upward, while a handful of well-patched machines could suppress it in ways that didn’t reflect reality. The average-based approach gives you an honest read of where your organisation actually sits, and connects the top-level number back to the individual assets and vulnerabilities that drive it.
4. Recommendation Impact – Per Asset, Per Vulnerability
This one directly addresses the “I remediated things and the score didn’t move” problem.
In the old model, the projected score impact shown for a security recommendation was a rough estimate. In the updated model, impact is calculated per asset and per vulnerability – so for each device that has a specific CVE, the model calculates what remediating that CVE on that specific device actually does to the overall score. Per Microsoft, the predicted score reduction now closely reflects the actual reduction you see after remediation.
As noted in the security recommendations documentation, these additional EPSS and asset context factors are now directly reflected in the recommendation impact scores.
This has two concrete effects:
- The impact estimates shown in the vulnerability management dashboard are now much more accurate predictors of actual score movement.
- When you remediate, the score is more likely to move in the direction and magnitude the model predicted.
Microsoft is upfront that score movement won’t always be monotonic – newly discovered vulnerabilities in the same daily recalculation can offset remediation gains. But the directional accuracy is significantly improved.
Why it matters: Your remediation plan now has more credible numbers behind it. When you tell leadership that patching a specific piece of software across 800 devices will reduce exposure score by X points, that estimate is built from real per-device modelling rather than a rough projection.
Old vs New – Side by Side
| Area | Previous Model | Updated Model |
|---|---|---|
| CVE Scoring | CVSS-driven | CVSS + EPSS + normalised CVE fields |
| Asset Scoring | Top vulnerabilities only | Combined impact of all vulnerabilities |
| Asset Context | Minimal weighting | Internet-facing status + asset criticality |
| Organisation Score | Potentially skewed aggregate | Average of individual asset scores |
| Recommendation Impact | Rough estimate | Per asset and per vulnerability |
What to Watch for During Rollout
The rollout is still in progress. Microsoft’s own docs are clear that two models are currently active across tenants simultaneously – depending on where your tenant is in the rollout, you might be on either one.
A few practical things to keep in mind:
Your score may shift without anything changing in your environment. If your exposure score looks different after an update cycle, don’t assume something happened on your endpoints. The scoring model itself is the variable. This is expected and documented – communicate it proactively to stakeholders before they ask.
Recommendation priorities may reorder. Because impact is now calculated per asset and per vulnerability, the ranked list of security recommendations may look different from what you’re used to. Items that previously appeared low-impact might surface higher, and vice versa.
Secure Score for Devices is unaffected. The exposure score update is entirely independent of Microsoft Secure Score for Devices. These two metrics are calculated separately. If you report on both, Secure Score is unchanged.
Recalculation is daily. After any remediation, allow up to 24 hours for the score to update. Not a new behaviour – just worth repeating since people tend to check immediately after patching and then raise a ticket wondering why nothing moved.
References and Documentation
- Exposure score model updates (transition overview)
- Security recommendations
- Vulnerabilities in my organization
- Microsoft Defender Vulnerability Management overview page
- Microsoft Secure Score for Devices